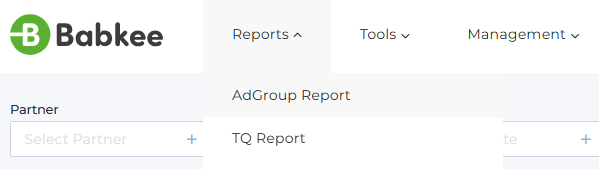
Babkee statistics system, in addition to the main Overview report, provides detailed reports on various metrics are available (Reports) and auxiliary tools for the buyers (Tools and Management sections).
Let's look into the first report in the Reports section - the AdGroup Report.
DASHBOARD
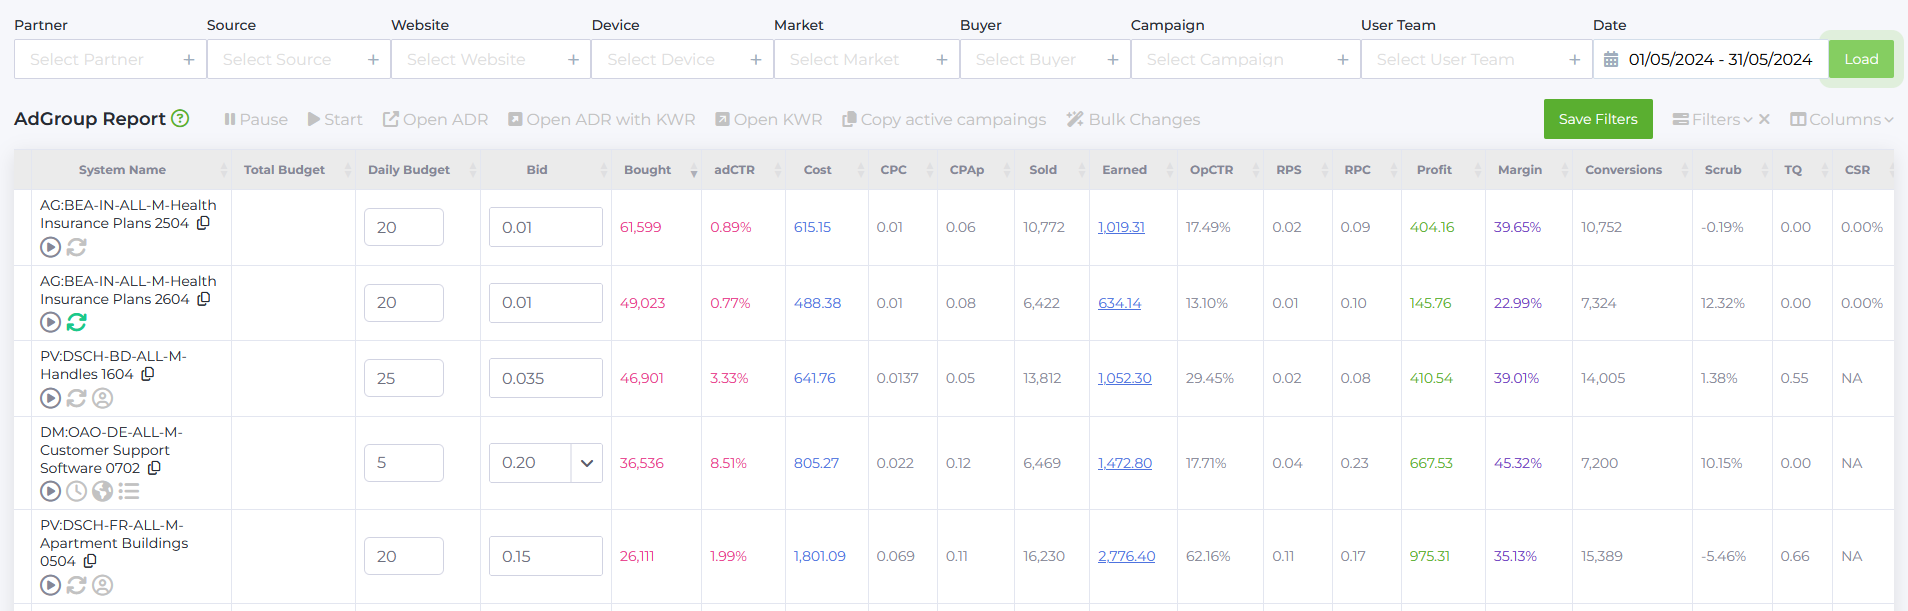
This report displays a list of advertising campaigns uploaded by buyers. After you upload a campaign, you may also find it in this report.
FILTERS
You can customize the report with the following filters:
Partner - A list of partners with whom we collaborate.

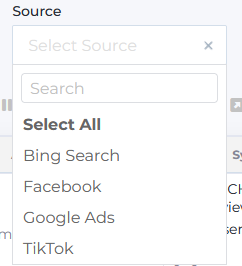
Source - A list of traffic sources.
Websites - A list of targeting websites.

Device - A list of targeting devices.

Market - A list of targeting countries (also referred to as ‘market’ or ‘geo’).

Buyer - A list of buyers registered in the system.

Campaign - A list of advertising campaigns. In Babkee system campaign is like a folder storage assigned to every buyer. The folder contain buyer’s ad groups.

Date - Statistics display period.

In these fields, you can select one or several parameters and save your custom filter for quick access. Choose the necessary parameters in the dropdown lists and click Save filters:

Enter filter name and click Save:

To remove filter, click on the cross in its upper right corner and in the pop-up window, and click OK.

Let's take a detailed look at the list of metrics that make up the report.
Campaign column - contains the prefixes of advertising campaigns.

Adgroup column - the name of the advertising campaign. It includes a description and the date when the campaign was launched..

System name column - The name of the campaign in the Babkee system. The name consists of: Buyer's first and last name (initials): Website (abbreviated)-Market-Device-Languages-Adgroup name. Below the name, the status is indicated (green color - campaign is active, gray - inactive), as well as links to the Keyword Rotation report and Advertiser report.
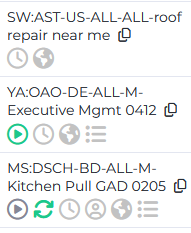
You can find the following hints and links under the system name:
Change Status - pause or run the adgroup
Keyword Rotation - link to Keyword Rotation report
Hourly Report-- link to Hourly report
Advertiser Report - link to Advertiser report
Country Report - link to Country report
Placement Report - link to Placement report
Total Budget column (USD) - the total maximum allowable budget of the advertising campaign. When the specified limit is reached, the traffic source will stop the campaign.
Available for Propeller Ads only.

Daily Budget column (USD) - the maximum allowable daily budget of the advertising campaign. When the specified limit is reached, the traffic source will stop the campaign.

Bid column (USD) - The maximum bid size (depending on the source, from Bid Strategy - CPC/CPM/CPA depending on the chosen payment model) that the buyer sets for the advertising campaign.

Bought column - the number of clicks purchased for the selected period.

adCTR column (ad=advertise, Click-through rate, %) - the weighted average CTR for the selected period.
CTR (click-through rate) shows the ratio of the number of users who clicked on the ad to the number of users who saw the ad.
Cost column (USD) - the amount spent on an advertising campaign for the selected period.

When selecting Date period of two days or more in the filter, clicking on Cost column opens a drop-down list with values for each day of the selected campaign range

CPC column (Cost per click, USD) - the cost of one purchased click (Bought) within the traffic source. Calculated as: Cost / Bought.

CPAs column (Cost per action, where s stands for Source, USD) - the average CPA per day in the traffic source. Calculated as: Cost / Conversions.

CPAp colum (Cost per action, USD) - the average CPA per day from the partner, considering scrub amount.
CPAp indicates the cost of one target action (click on our site via the advertising link). The cost equals the quotient between the values of Cost to Sold.

Sold column - The total number of clicks sold for the selected period.

Earned column (Revenue, USD) - the total revenue for the selected period.
The Ad Group Report displays distribution of revenue by each group. By selecting the necessary filters, you can see revenue by partner(s), site(s), etc.

opCTR column (On page click-through rate, %) - the average CTR on the target website for the selected period. The prefix “Op” means “on page", that is, on the page, users who clicked on the ad on the site are counted here. Calculated as: Sold / Bought * 100%.

RPS column (Revenue per session, in USD) the average revenue from each ad impression (Searches) for the selected period. Calculated as: Revenue / Searches.

RPC column (Revenue per click, USD) - the average revenue from a sold click (Sold) for the selected period. It is the ratio of the total revenue from the advertising campaign to the sold clicks (Sold).

Profit column (USD) - net profit for the selected period. The value is the difference between Earned and Cost metrics.

Margin column (%) - displays the average margin for the selected period. The indicator is calculated by the formula: Profit / Earned * 100%.

Conversions column - the number of conversions for the selected period. Visitors who performed the target action (in our case, this is a transition to the advertiser's page via a link in the search results).

Scrub column (%)
The indicator can take three values: positive, negative, and zero.
Positive value- the number of conversions exceeds the number of sold clicks. The difference is filtered out by the partner (they did not like the traffic, suspected bots). Time zone differences may also affect this.
Negative value - the number of sold clicks exceeds the number of conversions. Possible factors include: a single user making multiple clicks on ad links, restrictions on tracking ad actions, and bots that passed the antibot system.
Zero value - the number of conversions equals the number of sold clicks.
The indicator is calculated using the formula: (1 - Sold / Conversions) * 100%.

TQ quality column (Traffic quality) - traffic quality indicator.
The data is provided by the partner to whom we sell traffic. The value can range from 0 to 10 inclusive. This scale is used to assess the quality of traffic from the partner's perspective.
0 indicates bad traffic, 10 means good traffic.

CSR column (Click Spam Ratio, %) - an indicator inherent to 2-Click flow partners. It shows the percentage of bot clicks that the partner considers as such.
RPM column (Revenue Per Mille, in USD) - shows revenue per 1,000 impressions. Calculated as: (Revenue / Searches) * 1000

Searches column - represent the total number of times a search query is made.

Bidded Searches column shows the number of queries where the partner's ad was served.

Coverage column - the percentage of searches for which sponsored listings are returned. Simply put, of all the Searches you sent, what percentage were “filled” with impressions (Bidded Searches). Calculated as: Bidded Searches / Searches.

User column – List of users registered in the system.
User Team column – List of teams registered in the system.
Clicks – the total number of actual clicks on the ads.
Passed Clicks – the number of actual ad clicks that passed our bot detector check.
cScrub – the percentage of actual clicks that were filtered out by our bot detector. Calculated as: ((Clicks - Passed Clicks) / Clicks) * 100%.
pScrub – the percentage of actual clicks that passed our bot detector but were not counted by Yahoo. Calculated as: ((Passed Clicks - Sold) / Passed Clicks) * 100%.
FILTER SETUP
In addition to configuring standard filters to load data above the report, you can set up extra filters for minimum and maximum value display. Press the Filters button above the report to access them.

Available parameters for filter setup:
- Cost
- Sold
- Earned (Revenue)
- RPC (Revenue per Click)
- Profit
- Margin
- Conversions
- TQ (Traffic Quality)
- IsActive (Selection of only active or inactive campaigns)
- Created At (Selecting campaigns by creation date for the selected period)
You can also choose which columns are displayed in the report and which are hidden. To display columns, you need to mark them in the list and then click Apply. Columns that are not marked will be automatically hidden from the report.

GROUP OPERATIONS
The report also allows to interact with campaigns: pause and start them, change campaign budget and bid.
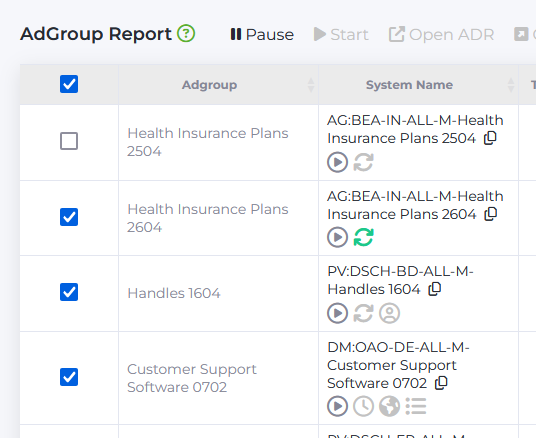
By marking several campaigns in the list, you can apply group changes - pause or start campaigns. To make changes, select the necessary campaign from the list by ticking it. In the field above, select the desired action:
Pause - to pause the campaign
Start - to launch the campaign
Open - to open a detailed Ad group Daily Report in a new tab (if it does not open automatically, enable pop-up windows in browser settings)
You can apply group changes (pause or start campaigns) by marking several campaigns in the list.
To change bid parameters, also select one or several campaigns in the list and press Bulk Changes.

1 Select action type: Increase, Decrease, or Set Value (set a fixed value);
2 Select the object: Bid, Daily Budget, or Total Budget.
3 Select input value: Percent or Amount.

4 Enter the value and apply the changes by pressing Update.

The table bottom displays average and total values value for all table parameters.

Average values stand for weighted average. Total values are calculated for the following parameters: Bought, Cost, Sold, Earned, Profit, and Conversions. For parameters marked as NA, statistics are not provided by the source.
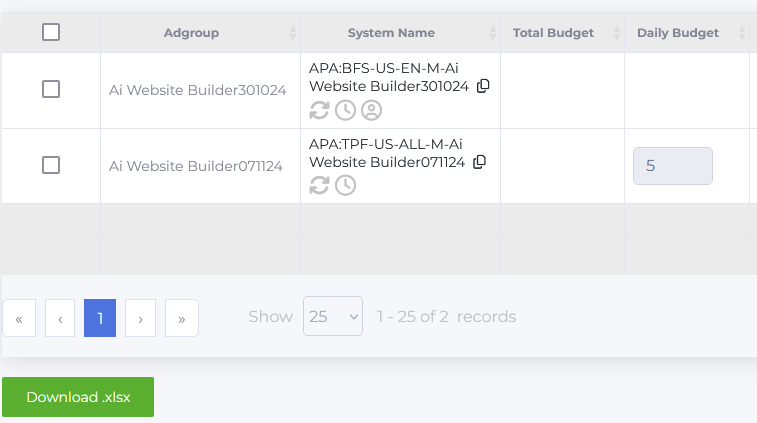
The total number of campaigns and the number of items shown per page are located below the table. If necessary, the number of displayed elements can be changed (10, 25, 50, 100, or all).
You can download the report by exporting it to .xlsx format. Press the Download .xlsx button to start download.
The report also allows to search campaigns: by campaign name, a single word, or group campaign search.

Enter the word or copy and paste the full campaign name in the search field near user login, and press Enter. The search will return all advertising campaigns in the list according to the request.
To find several campaigns at once, select these campaigns by clicking the copy button:
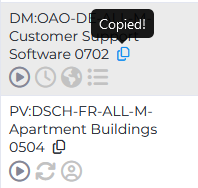
Save the name list in any document:

Copy the full list, paste it into the search field, and press Enter. The requested campaigns will be displayed in the report: