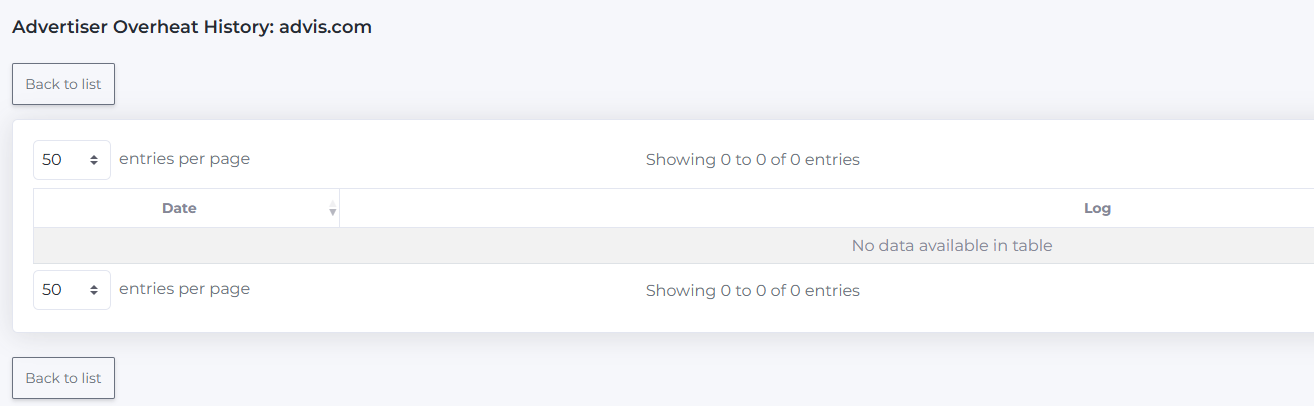
Advertiser Overheat History is an analytics tool that allows you to track the history of changes in an advertiser’s overheat status over time.
How this will help you in your work: You will be able to monitor the history of changes in advertisers’ statuses. For example: if an advertiser was red and then turned green, you can immediately ask yourself: what happened? Why did the number of Passed Clicks drop so much? What is the reason? Maybe fewer campaigns started targeting this advertiser, but why? Possibly the advertiser started showing less frequently, or their budget was reduced.
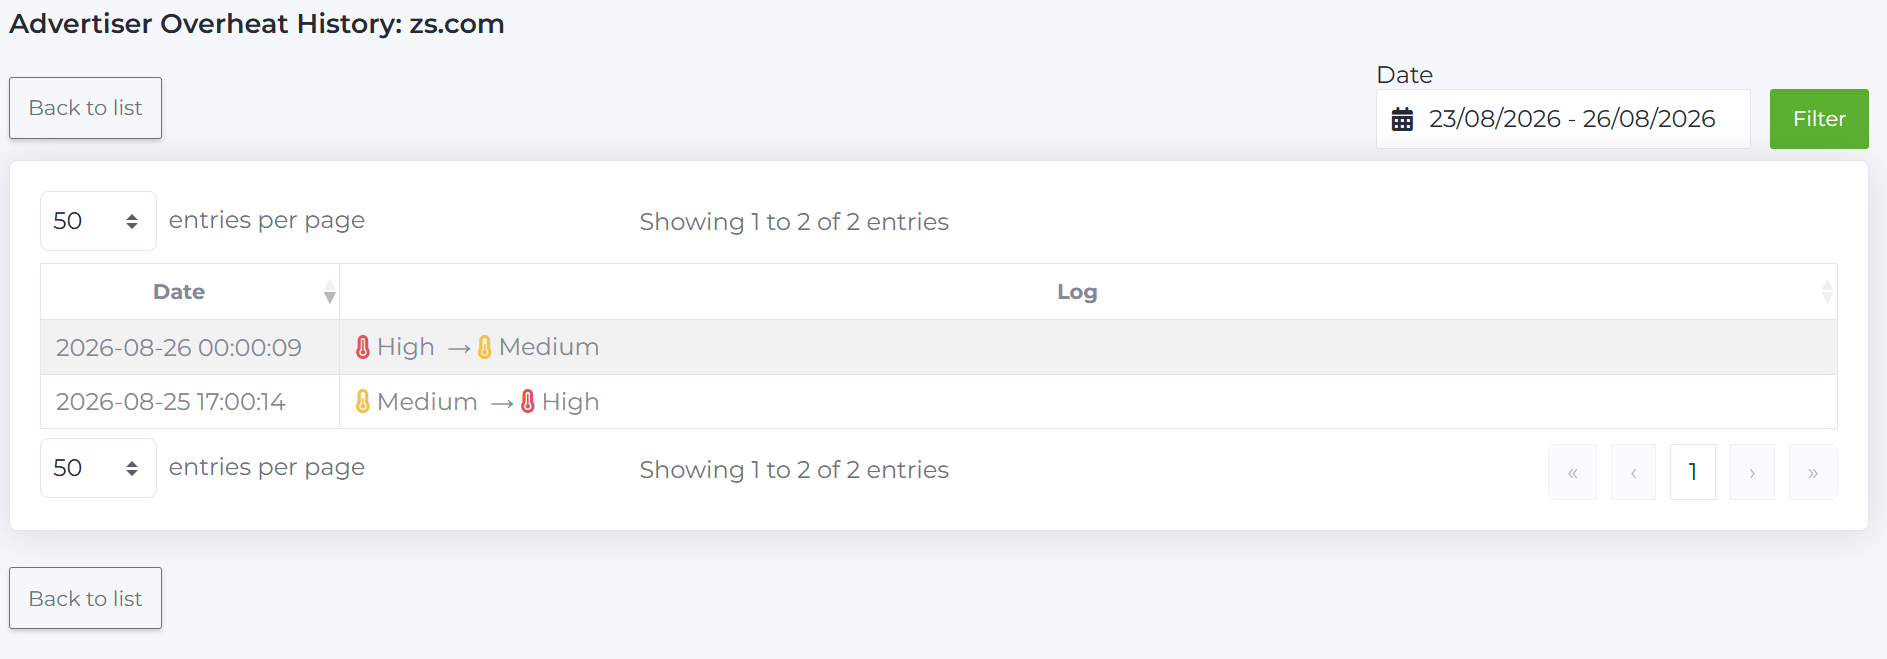
Above the table:
- The Date filter allows you to select a time period. Logging of history started on August 25, 2026. There is no data in the database for earlier periods.
- The Back to list button redirects you back to the Advertiser Report.
The table contains the following columns:
- Date: the date and time of the status change.
- Log: a history of changes in the overheat status.
How to read the changes table: The table shows the exact date and time when the advertiser’s status changed. The arrow shows the transition: [Old status] → [New status]. For example, a record like Medium → High means that before the specified time, the advertiser had a medium overheat level, and afterward it became high.

What to do if the table is empty: If you selected a period but the table remains empty — this is normal, not a bug. It means that during the selected time frame, the advertiser’s status did not change and remained stable. Logs only appear at the moment of changing from one state to another.