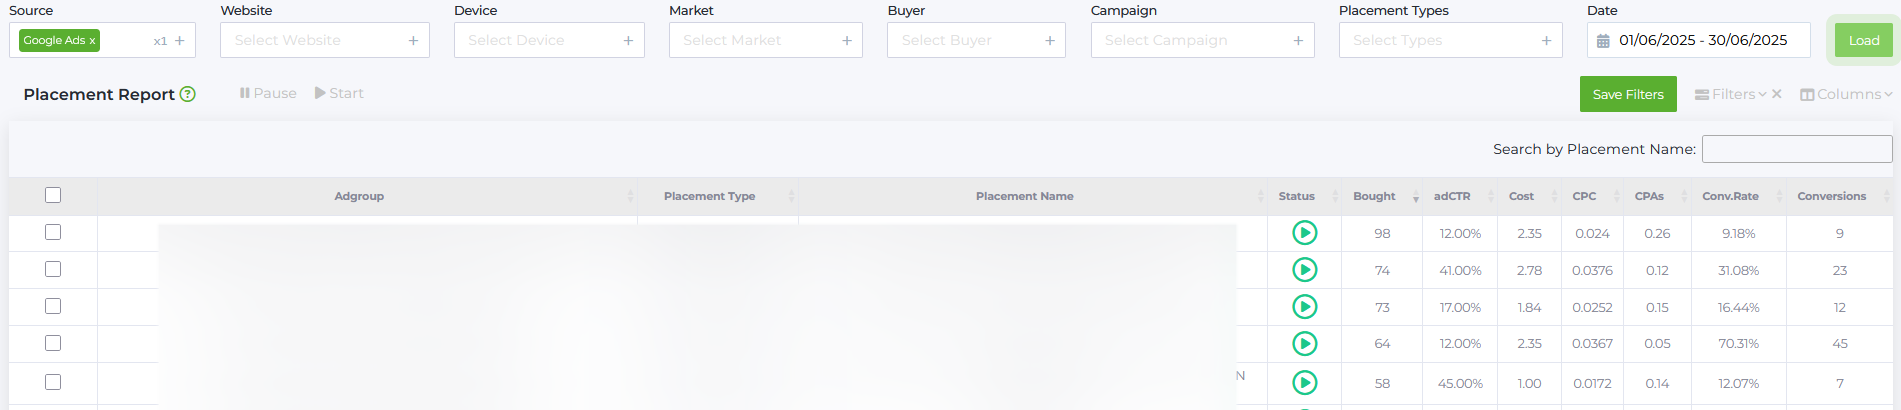
Placement Report provides statistics on the distribution of advertising campaigns across different platforms.
To display the data, select Source and Website.
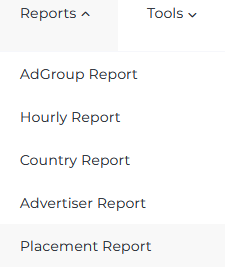
To launch the report, open the Reports dropdown menu and select Placement Report from the list:
FILTERS
You can customize the report with the following filters:
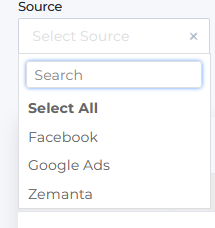
Source - A list of traffic sources.
Websites - A list of targeting websites.
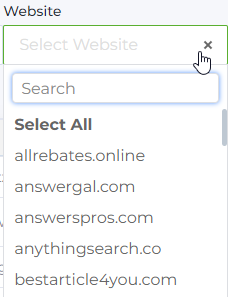
Please select the Source and Website to load placement data.
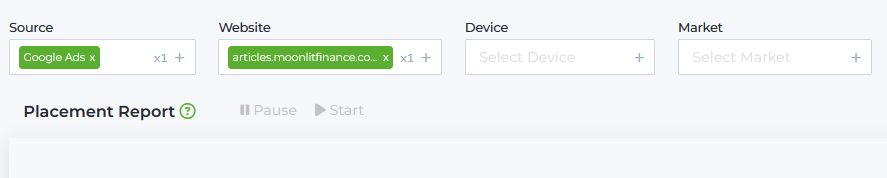
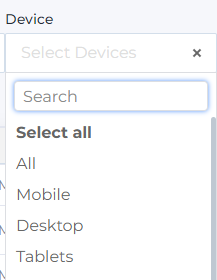
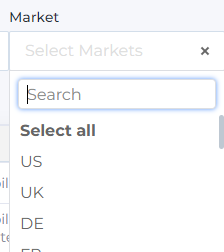
Market - A list of targeting countries (also referred to as ‘market’ or ‘geo’).
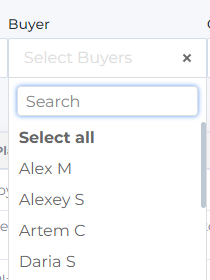
Buyer - A list of buyers registered in the system.
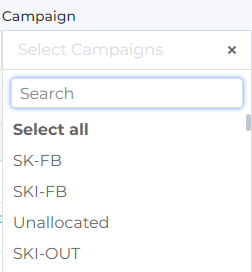
Campaign - A list of advertising campaigns. In Babkee system campaign is like a folder storage assigned to every buyer. The folder contain buyer’s ad groups.
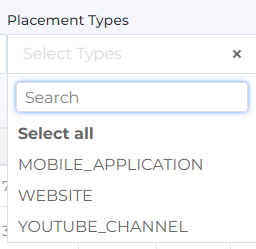
Placement Types - Types of advertising placements where the ad may be displayed: mobile application, website or YouTube channel.
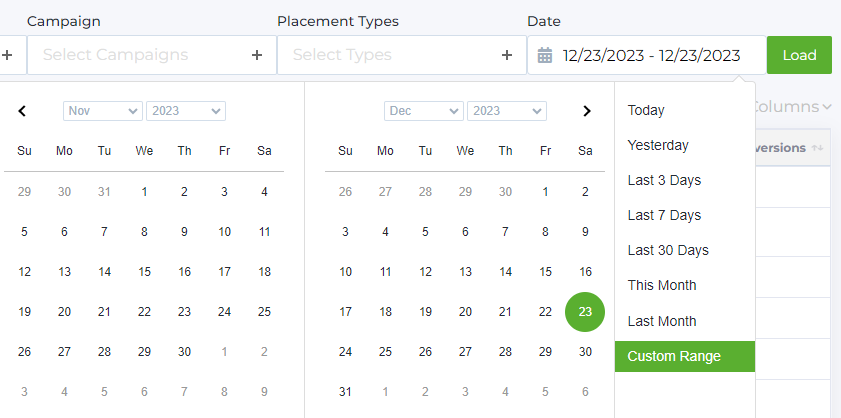
Date - Statistics display period.
REPORT CONTENTS
Let's take a detailed look at the list of metrics that make up the report.
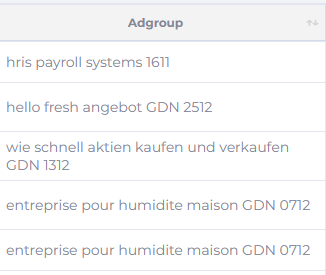
Adgroup column - The name of the advertising group. It may contain ad description and the date when the campaign was launched, and additional information at the buyer's discretion.
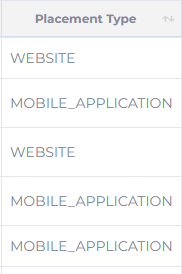
Placement Type column - Types of advertising platforms where the ad may be displayed: mobile application, website, or YouTube channel.
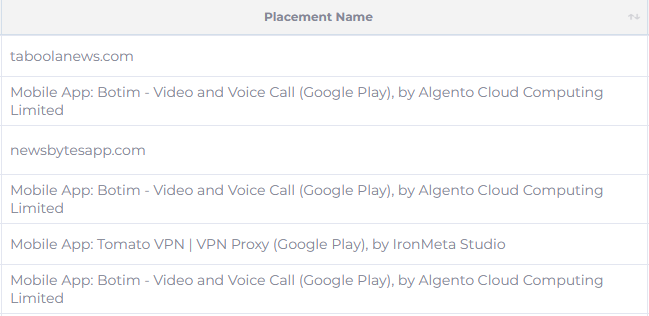
Placement Name column - The name of the website, mobile application, or YouTube channel where the ad is displayed. You can also find direct links to websites, apps, or channels, if you export the report to .xlsx format.
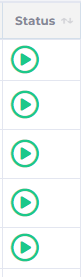
Status column - The ad group status. Green shows active campaigns, and gray displays disabled campaigns. You can stop or start a campaign from the report without logging into your Google Ads or Zemanta account.
Impr (Impressions) – the number of times ads were shown.
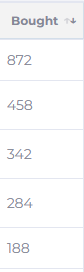
Bought column - The number of purchased clicks. The column shows info on the number of clicks bought for each ad group in the corresponding placement (site, app, or channel) during the selected period.
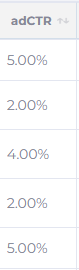
adCTR column (Click-through rate, %) - The weighted average CTR for the selected period.
CTR (click-through rate) shows the ratio of the number of users who clicked on the ad to the number of users who viewed the ad. Calculated as: Bought / Impressions*100%.
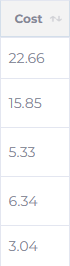
Cost column (USD) - The amount spent on the advertising campaign during the selected period in the corresponding placement (site, app, or channel).
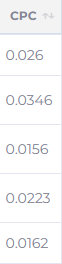
CPC column (Cost per click, USD) - The cost of one purchased click (Bought) within the traffic source during the selected period in the corresponding placement (site, app, or channel). Calculated as: Cost / Bought.
CPA – the average CPA value based on Passed Clicks. Calculated as: Cost / Passed Clicks.
Since conversions are reported with up to an hour delay, the CPA values may not be entirely accurate. There are also cases when, for example, no conversions are shown for yesterday (Conv = 0) even though there were actually some conversions—they simply arrived later. To avoid such situations, we display the CPA value based on Passed Clicks.
Please be careful when working with publishers and placements. Keep in mind that conversions are reported with a delay, so the data may sometimes look worse or better than it actually is. Therefore, it is better to optimize your work based on Passed Clicks, as this metric is more accurate.
CPAs column (Cost per action, s - Source, USD) - The average CPA in traffic source in the corresponding placement (site, app, or channel). Calculated as: Cost / Conversions.
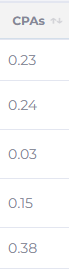
CPA is the average CPA score based on Passed Clicks. It is calculated using the formula: Cost / Passed Clicks
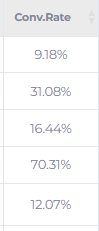
Conv.Rate column (Converion Rate, %) - The average ad group conversion rate in traffic source in the corresponding placement. Calculated as: Conversions / Bought * 100%
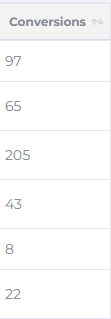
Conversions column - The number of conversions in the selected period for the corresponding placement (site, app, or channel).
Clicks – the total number of actual clicks on the ads.
Passed Clicks – the number of actual ad clicks that passed our bot detector check.
cScrub – the percentage of actual clicks that were filtered out by our bot detector. Calculated as: ((Clicks - Passed Clicks) / Clicks) * 100%.
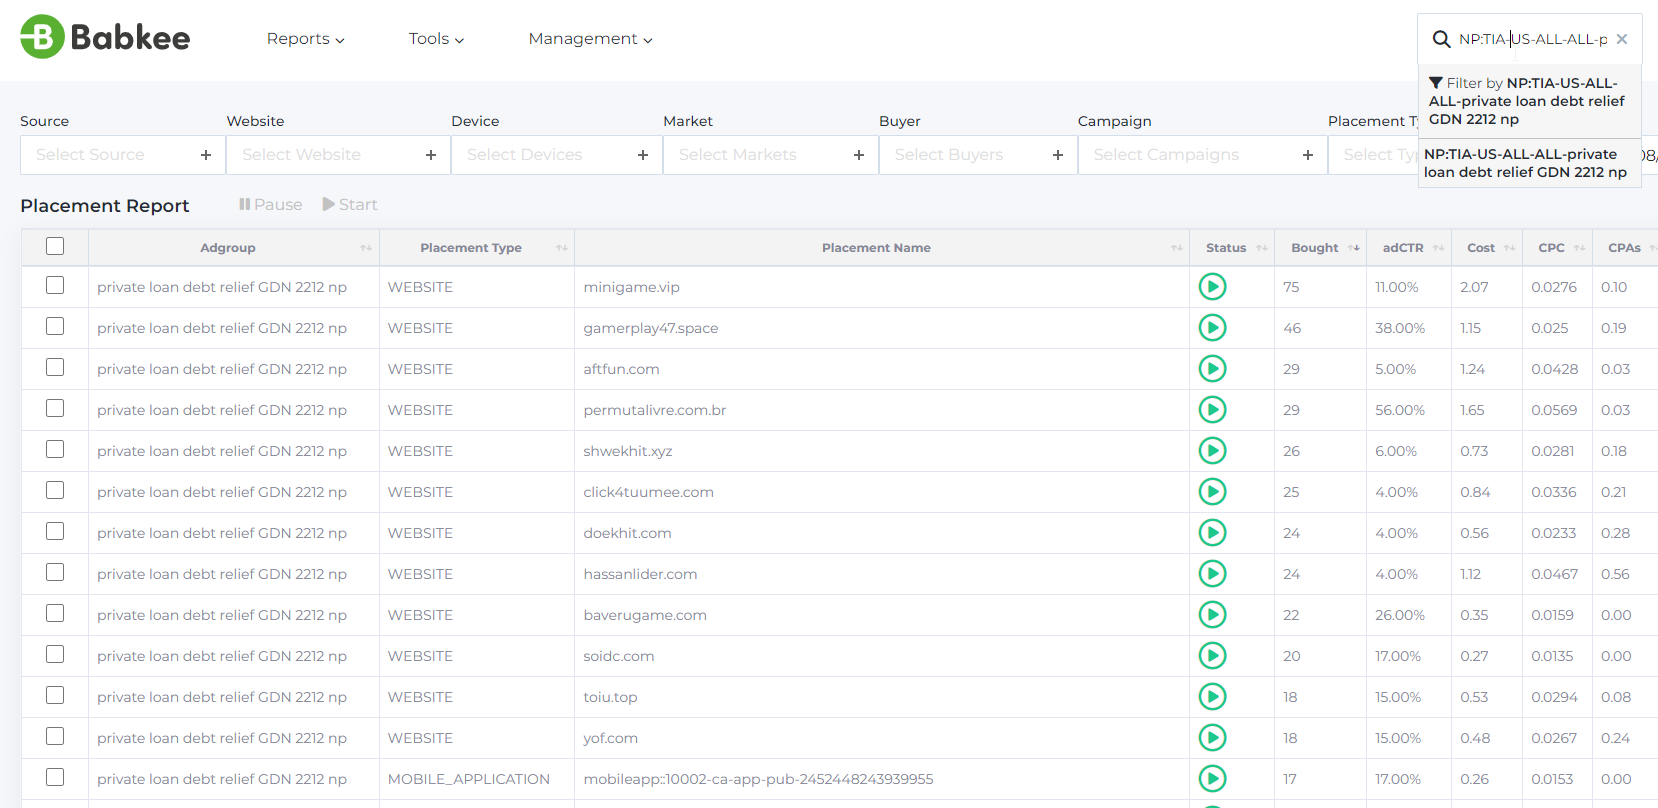
The report also supports search by ad group. You can paste the ad group name in the search field at the right top of the page and get statistics for that selected ad group only:
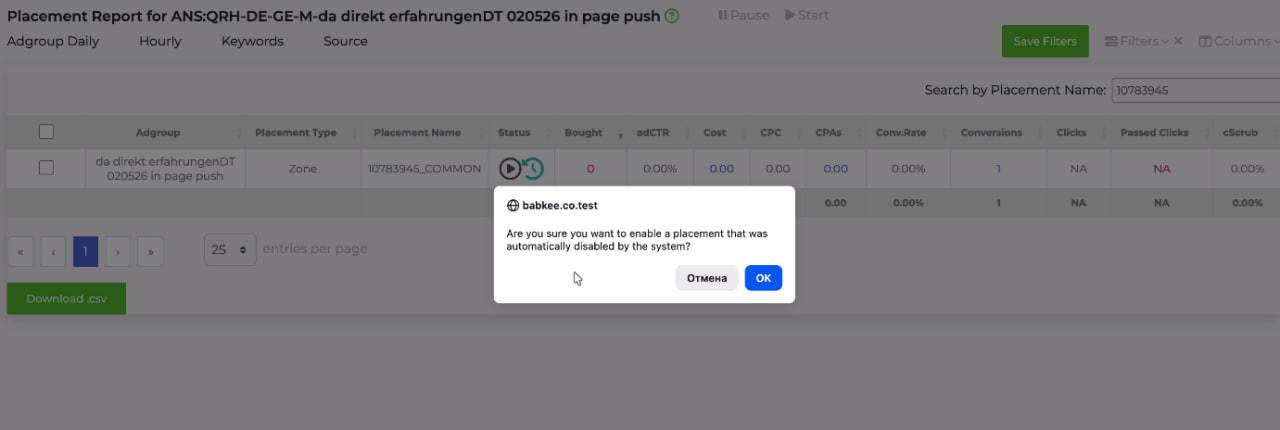
NOTE: if the automation has blocked the zone and the user wants to turn it back on, a confirmation pop-up window will appear. After you click "OK", there will be no additional messages, and this placement will no longer be automatically blocked within this ad group.
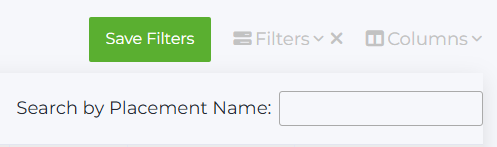
Search by Placement Name option lets you quickly filter all ad groups that use the selected placement
FILTER SETUP
In addition to configuring standard filters to load data above the report, you can set up extra filters for specific data display. Press the Filters button above the report to access them:
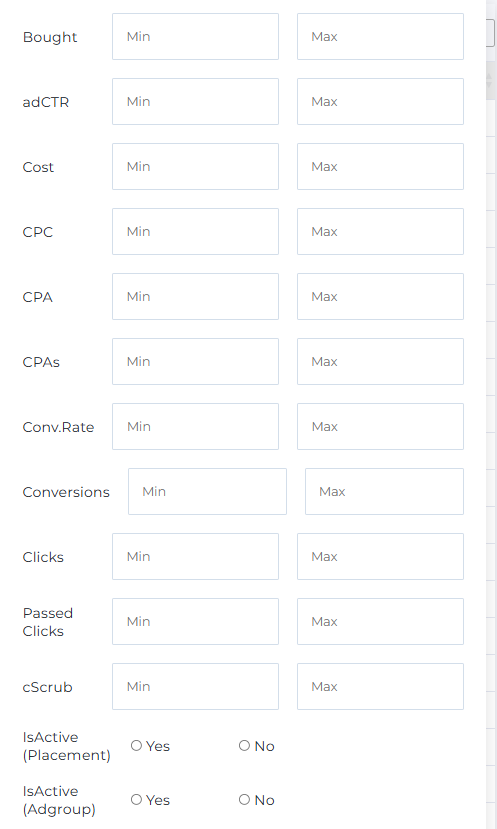
isActive (placement) – sorting by active and crowded publishers (zones).
isActive (Adgroup) – sorting by active and disabled ad groups.
You can set up the display from a certain minimum to maximum value according to the specified parameters.
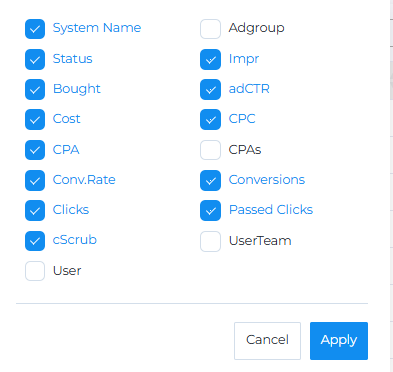
You can also select which columns will be displayed in the report and which will be hidden. To display columns, check them in the list, then press Apply. Columns that are not checked will automatically be hidden from the report.
GROUP OPERATIONS
The report provides the option to interact with ad placements: you can pause or start them.
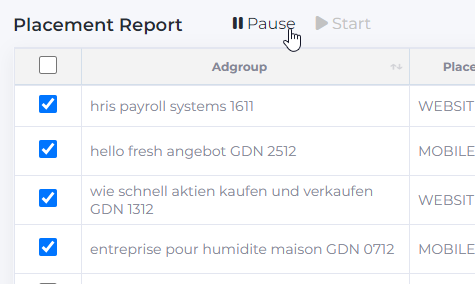
Click on the checkboxes for the necessary groups and press Pause or Start button above the table.
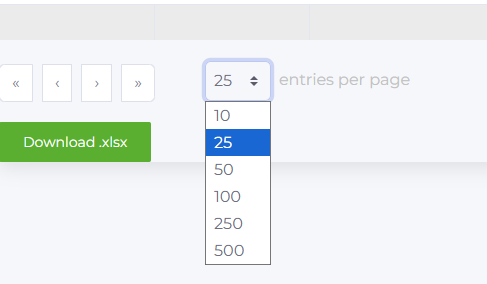
Below the report, you can see the total number of campaigns available for the selected period and the number of data displayed per page. If necessary, you can change the number of items displayed (select 10, 25, 50, 100, 250 or 500).
You can also export data from the report to .xlsx format. Press the Download .xlsx button to start export.
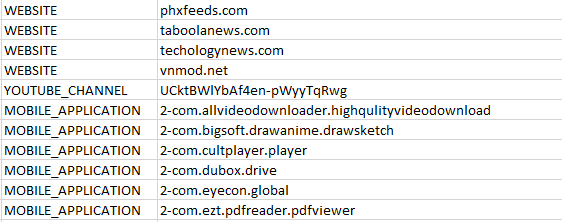
The document will contain an additional Placement column with ad placement details:
direct link (for websites)
app link in the mobile store (for mobile applications)
direct channel link (for YouTube channels)